Intro
Last month I participated in the NASA Space Apps Challenge 2019. Our team went for the Rising Water challenge:
Sea levels are rising around the world, and approximately 40% of the human population live in coastal zones. Your challenge is to help communicate the impacts of rising oceans by creating a visualization tool that illustrates the changes caused by rising sea levels in your region.
It was agreed that our app would basically show what things are like BEFORE and AFTER water-level rise, and we hoped this would increase awareness on the issue. Since there were five of us on the team, we divided the tasks up. Mine was mainly to get hold of satellite images of coastal areas that are considered the most vulnerable to rising water and artificially inundate them with various hypothetical water levels. This led me to discovering the Google Earth Engine. This post is a brief introduction to this tool.
Google Earth Engine
There is a lot of satellite imagery and geo-spatial data out there. Many scientific missions take measurements of some aspect of the Earth, but the data tends to be available through their own website, usually as large downloadable files, each of which might correspond to a certain observational period and can contain a large number of observed variables.
The problem with this is that you might only need a few of these variables but across many different observation periods. Due to the large file size, you can only process one file at a time on your computer, so you have to download a file, take whatever little bit is needed and discard the rest, before grabbing other observational periods' files. And if you find that, actually, this mission's data isn't all that useful, you need to go to another mission's website, and repeat the above process. This really impedes efficient data exploration, and if you happen to need all the data at the same time, you simply cannot do it due to the lack of computing resources.
Luckily, it turns out that some smart people have already done the hard work of collecting data from many scientific missions, organising and storing them in a database, and they have made lots of common and useful analysis algorithms ready to be executed on the data in an efficient manner, all on Google's servers. And they have packed all this into a freely available tool called the Google Earth Engine (GEE).
How do I use the Earth Engine?
The Earth Engine is mostly used through its code editor inside a web browser, where javascript is used to access, analyse and export data, though a python API is also available outside the browser. In any case, you need the internet.
Let's look at this short example:
var L5coll = ee.ImageCollection('LANDSAT/LT05/C01/T1_SR')
.filter(ee.Filter.lt('CLOUD_COVER', 20))
.select(['B3', 'B2', 'B1'])
.filterBounds(geometry)
NASA's LANDSAT mission has many data products available in the GEE. The particular one used here is LANDSAT/LT05/C01/T1_SR, which is essentially a set of images covering patches of Earth's surface at different points in time. They are loaded into the GEE with ee.ImageCollection.
Each image comes with a set of properties, such as image quality, solar azimuth angle, and cloud cover. In the current example, .filter(ee.Filter.lt('CLOUD_COVER', 20)) tells the GEE to keep only those images whose cloud cover is less than 20%. This is needed when you want relatively clear days, so that you can see the earth's surface.
These images also have more channels than the the normal photograph, covering a larger range of the electromagnetic spectrum. .select(['B3', 'B2', 'B1']) keeps the usual red, green and blue channels, discarding the rest.
Finally, .filterBounds(geometry) keeps only those images that have some overlap with the geographical feature geometry, which can be a use-defined point location or polygon on earth. Say that the geometry here is a point centred on Milan, then you will only be left with those image patches that contain Milan, none from anywhere else.
This chain of method calls reduces what is originally a large collection of images to a smaller subset.
The data from many scientific missions or projects are availalbe in the GEE, not just those from NASA. Another well-known satellite imagery mission whose data is available in the GEE is European Space Agency's Sentinel. Whatever major or important data you can think of in earth science, chances are it's already there in the GEE.
In the code, everthing that starts with ee. is a function that will be run on Google's server, otherwise it runs locally on your computer.
Highly recommend working in the browser
Here is what the GEE editor in the browser looks like:
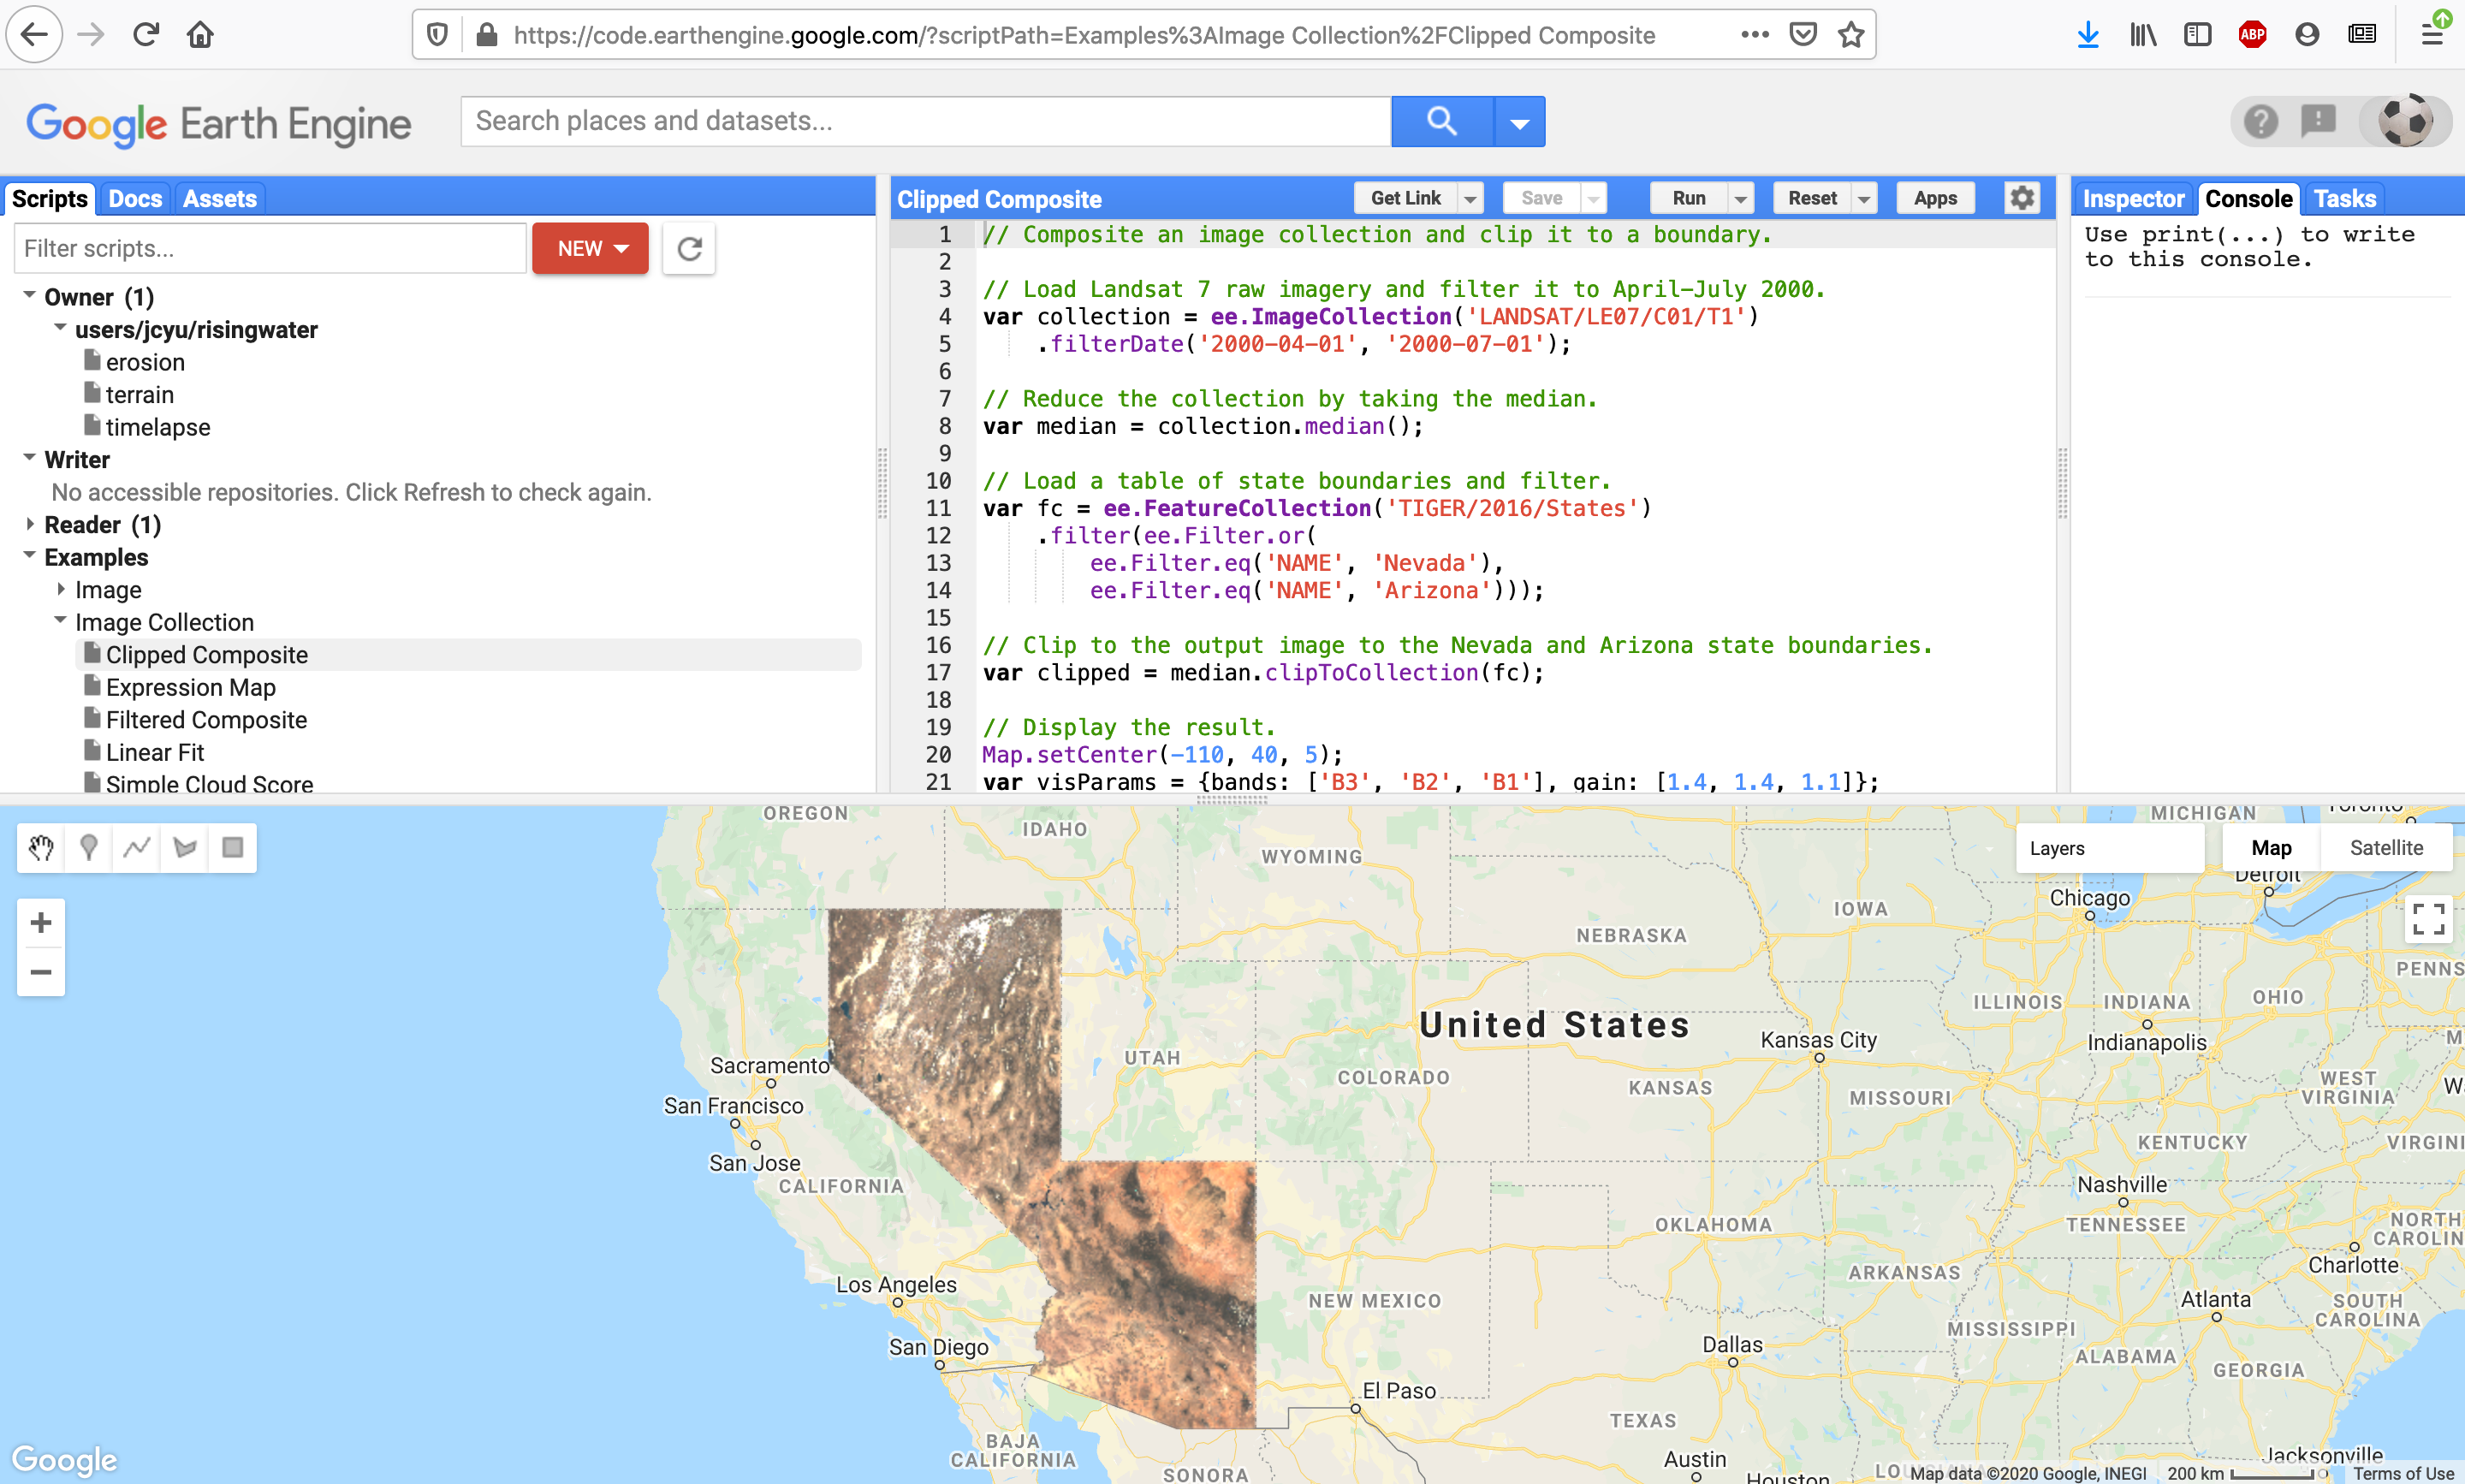
The top-middle panel is where javascript code is entered, and it is executed when you click the run button. Since there's integration with Google Earth, the output of your code is visualised in the bottom panel. If you decide to zoom in to get a closer look, GEE automatically re-computes so that the apparent resolution of the visualisation is the same.
This integration also allows you to define inputs to your code. You can define the region only over which you want GEE to compute by drawing it in the Google Earth panel.
In the top left panel, under Scripts/Examples, you can find many javascripts scripts for many common analysis procedures for many common datasets. These are extremely helpful for someone with no prior javascript experience like me. Also, you can more quickly build on these scripts to fit your needs.
The search box at the top allows one to search for datasets, examples, and locations. Very handy.
If you already work in an earth science-related field or are a domain expert, you probably already know what the dataset you're after is called, in terms of some cryptic abbreviations. However, even if you don't know, the search box allows you to easily search for it. Just enter, say, "LANDSAT" into the search box and choose one of the auto-completed LANDSAT dataset names displayed to go to its information page where everything about it is detailed.
Where can I learn more?
The EE101 Condensed: Fast start to the Earth Engine API tutorial by Noel Gorelick has a really good introduction about the motivation and overall design of the Earth Engine, followed by increasingly more complex examples.
He says that if you understand everything in this tutorial, then you are likely to be able to do everything else with the Earth Engine. I have also found the GIS Stack Exchange community to be very helpful.
Artificial inundation examples
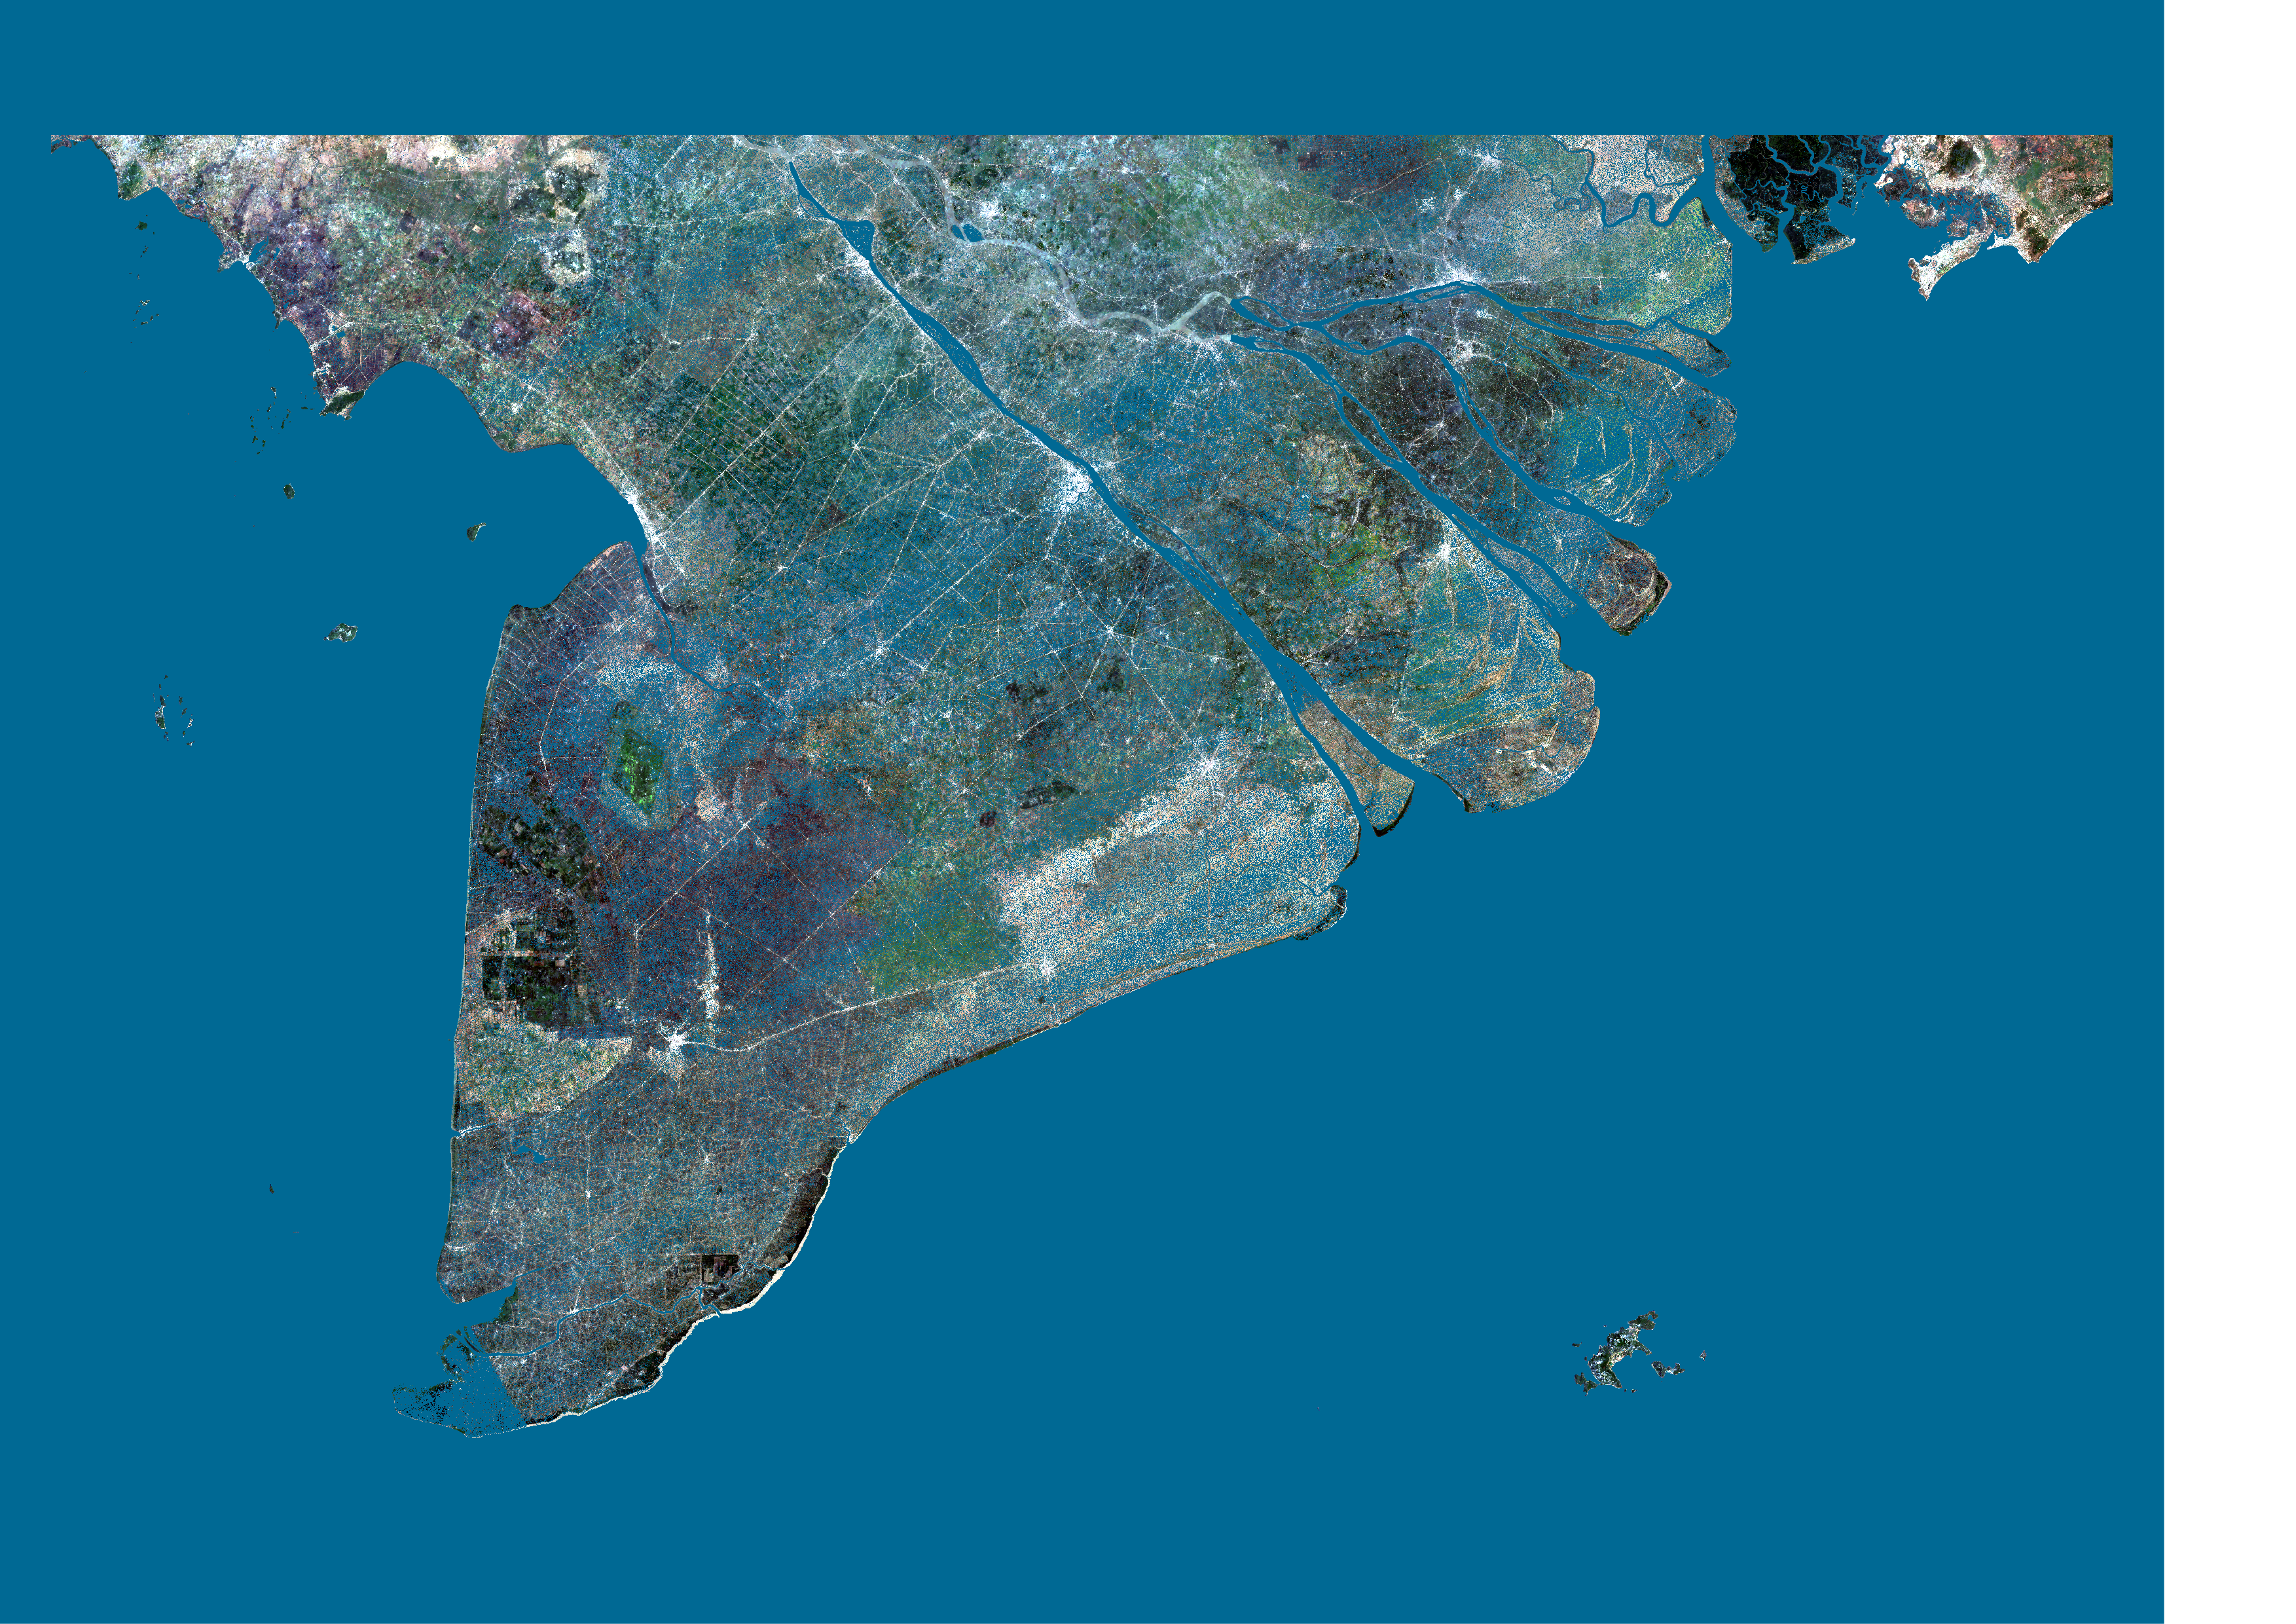
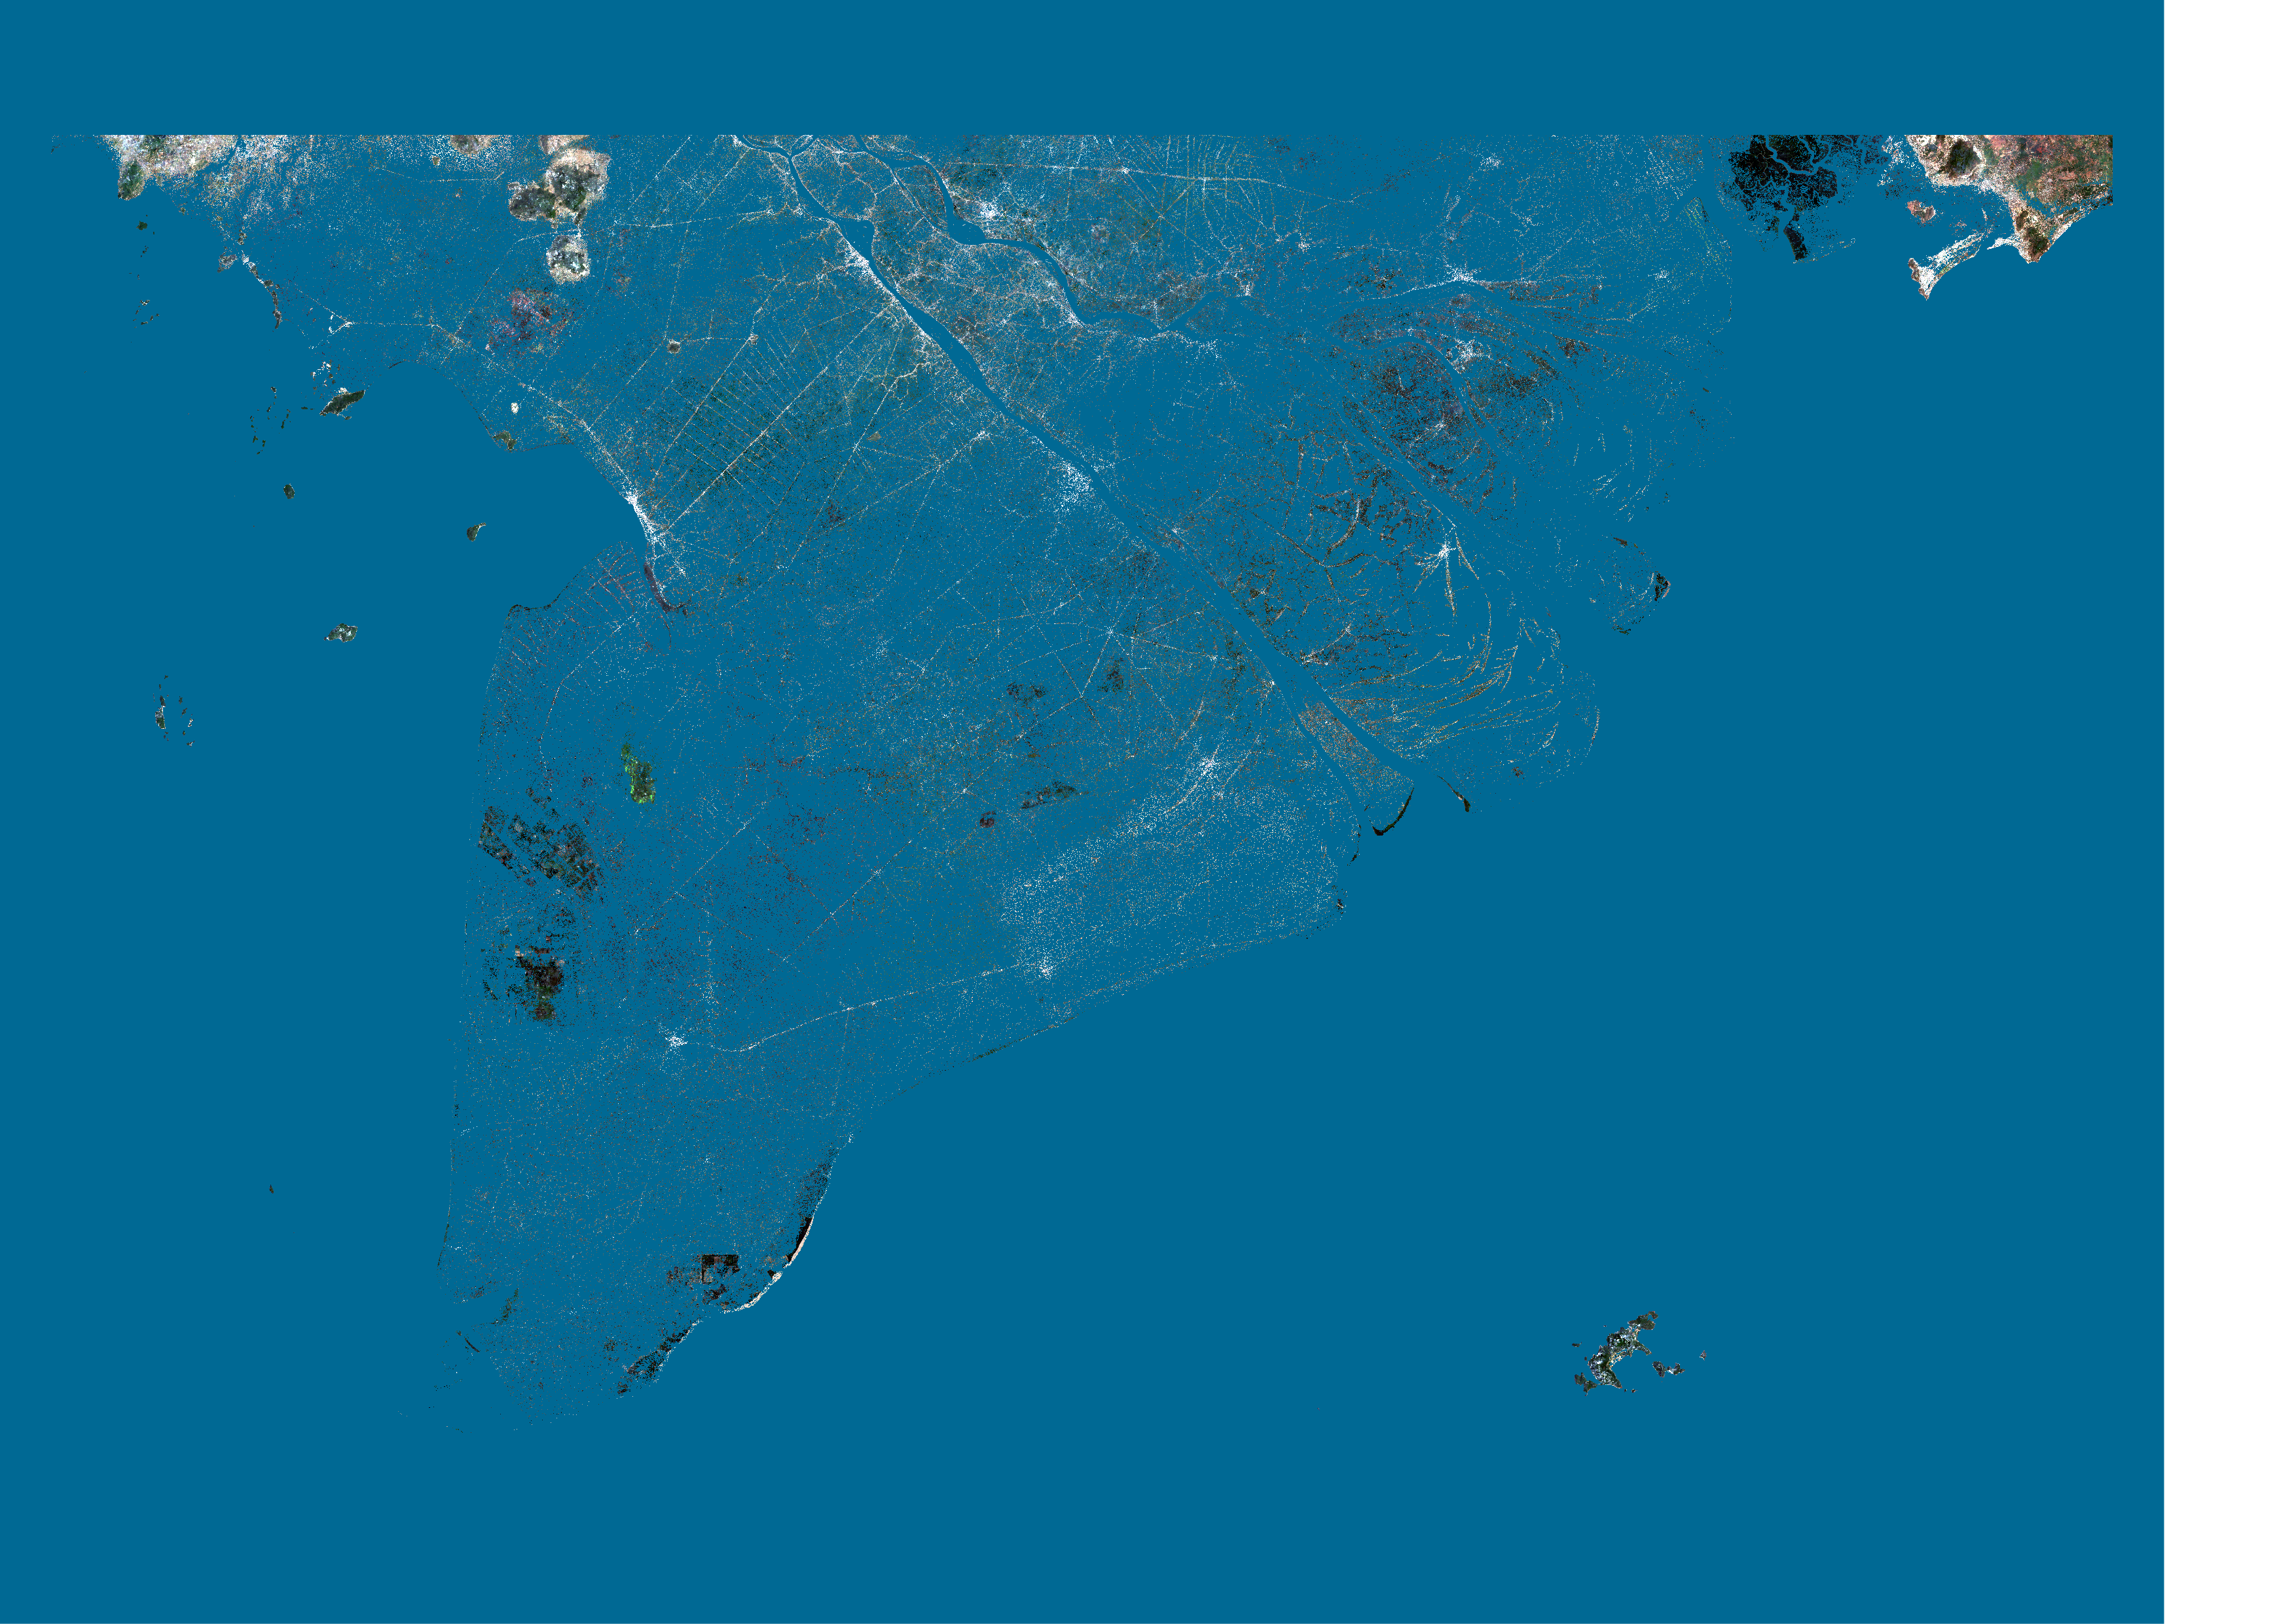
The Mekong Delta is one of the world's most vulnerable regions to rising sea level. Using GEE, images of this region's southern tip taken by the Sentinel satellites are combined with elevation data from the USNGS (also available within GEE). Areas under 0 metre and 4 metre elevations are coloured blue in the following images, respectively, to get a rough idea of the amount of area that will become submerged should the sea-level rise by 4 metres:
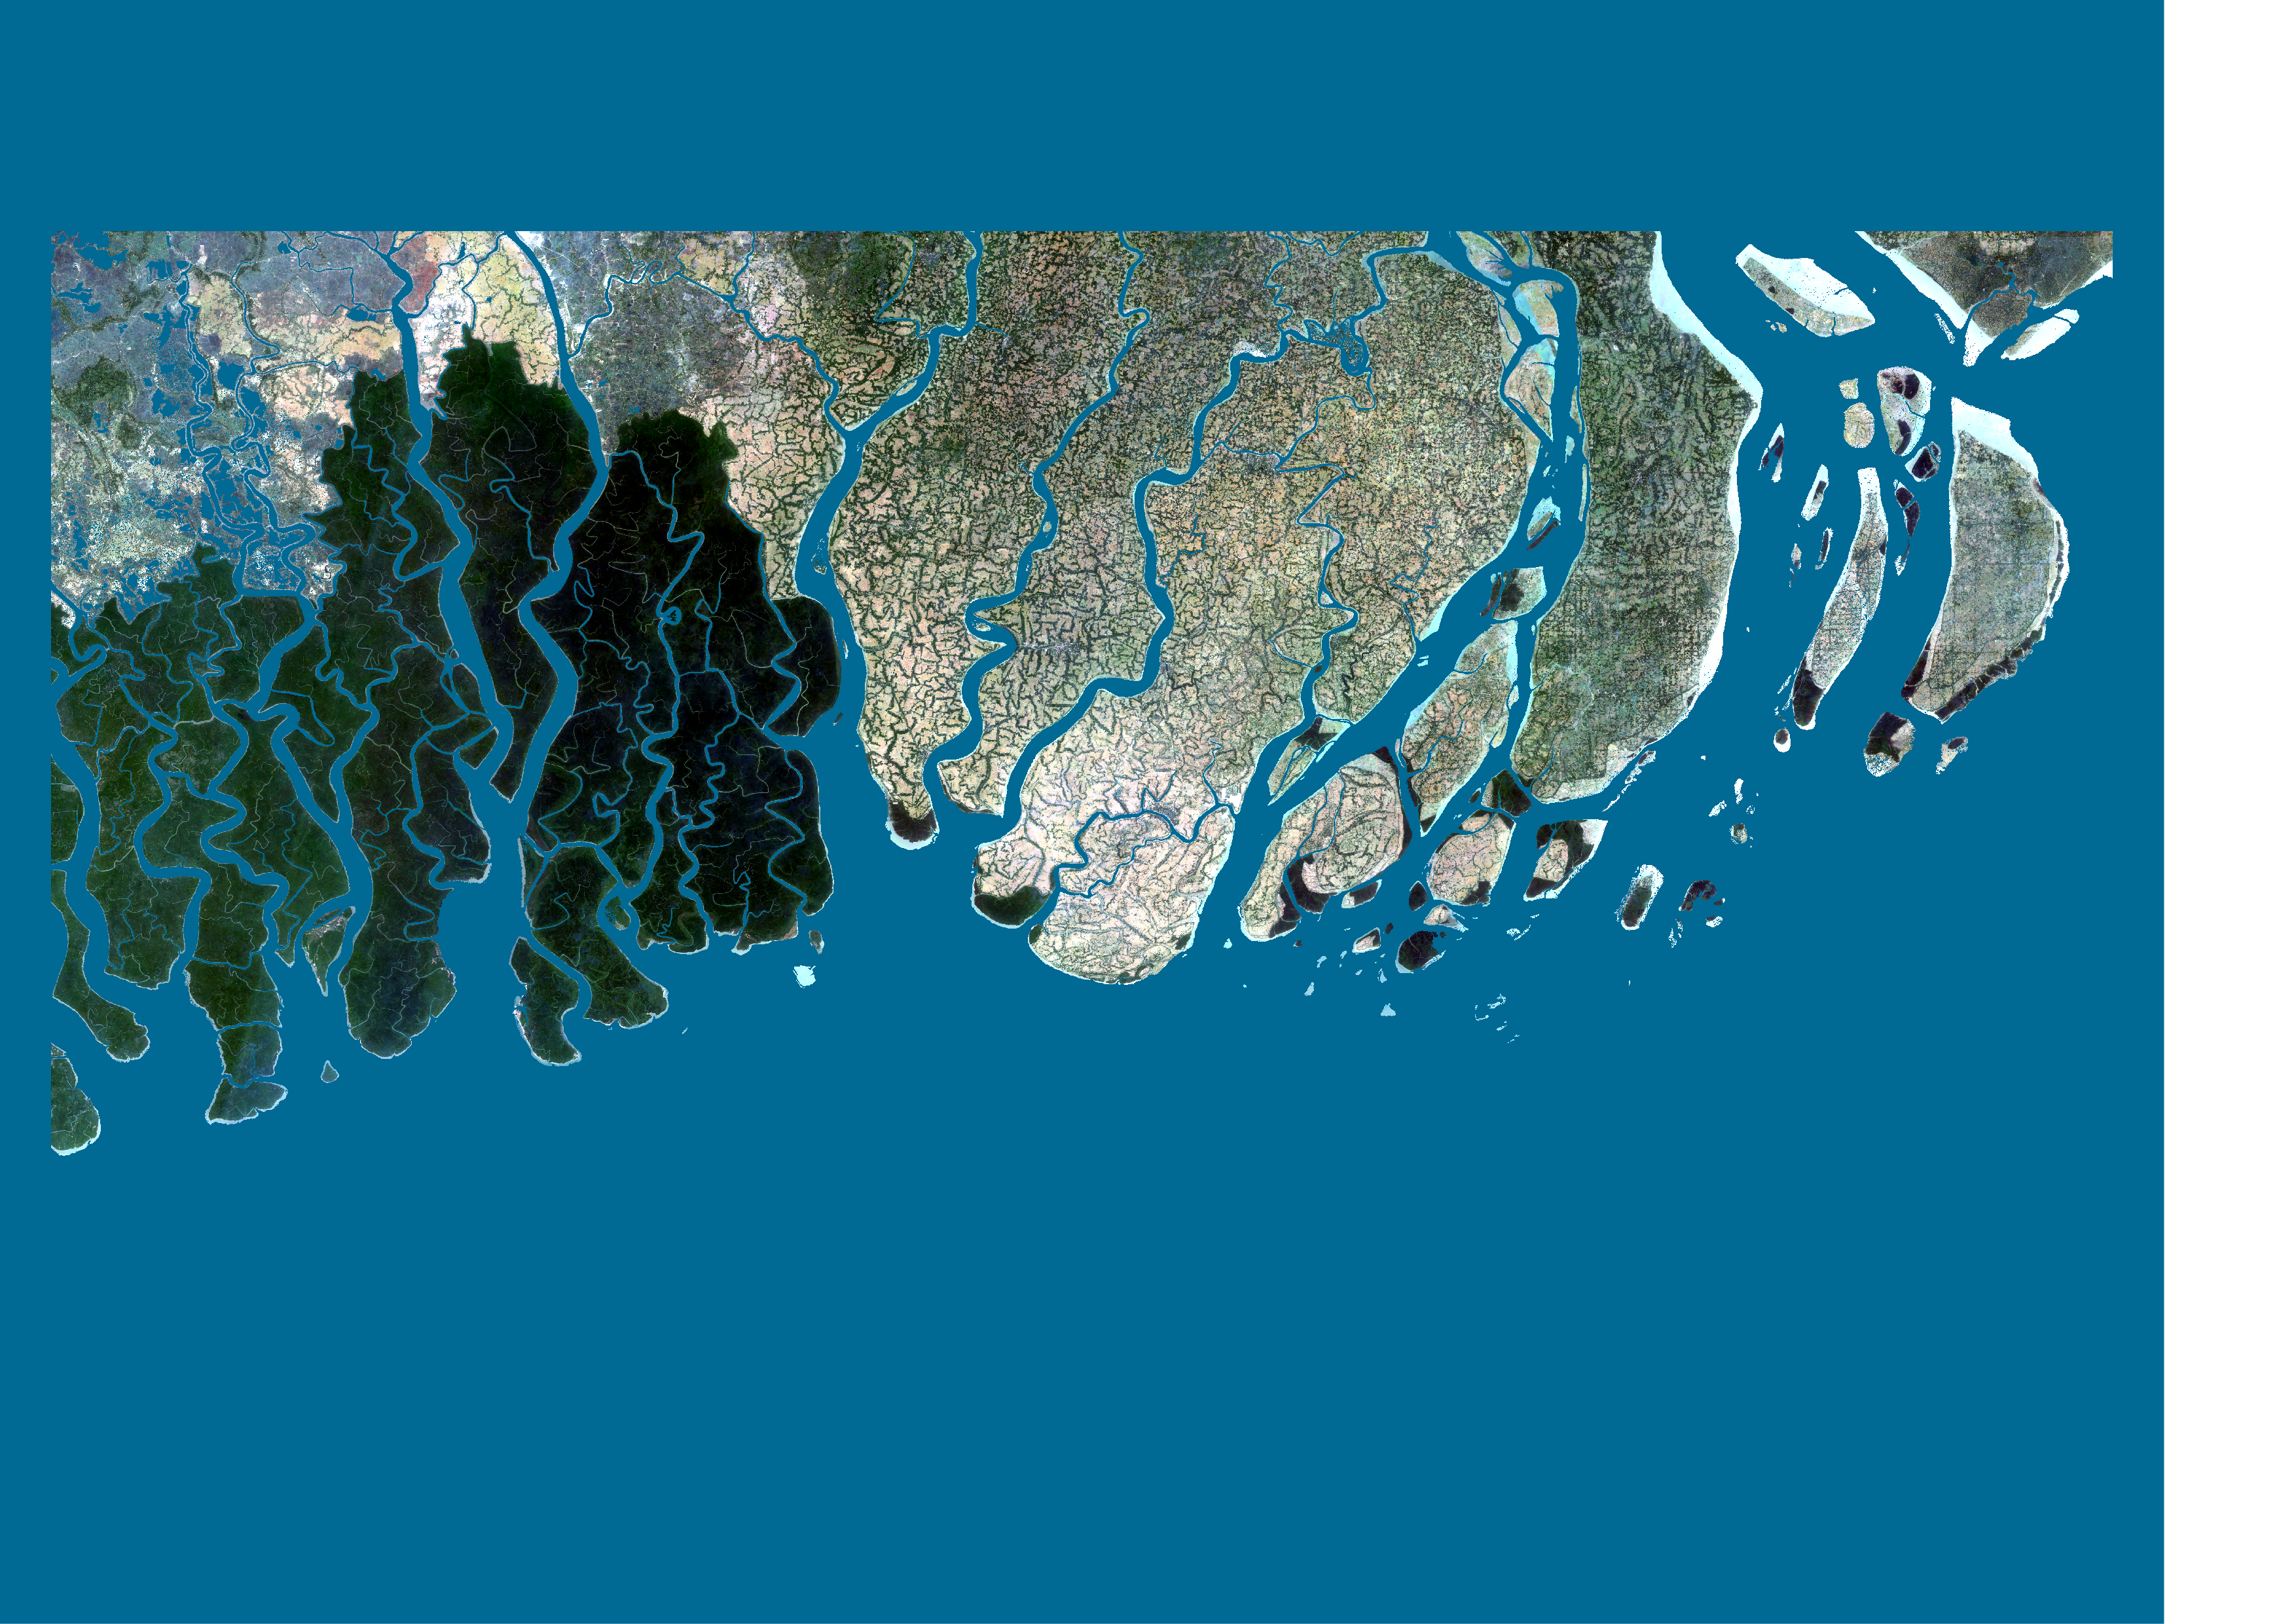
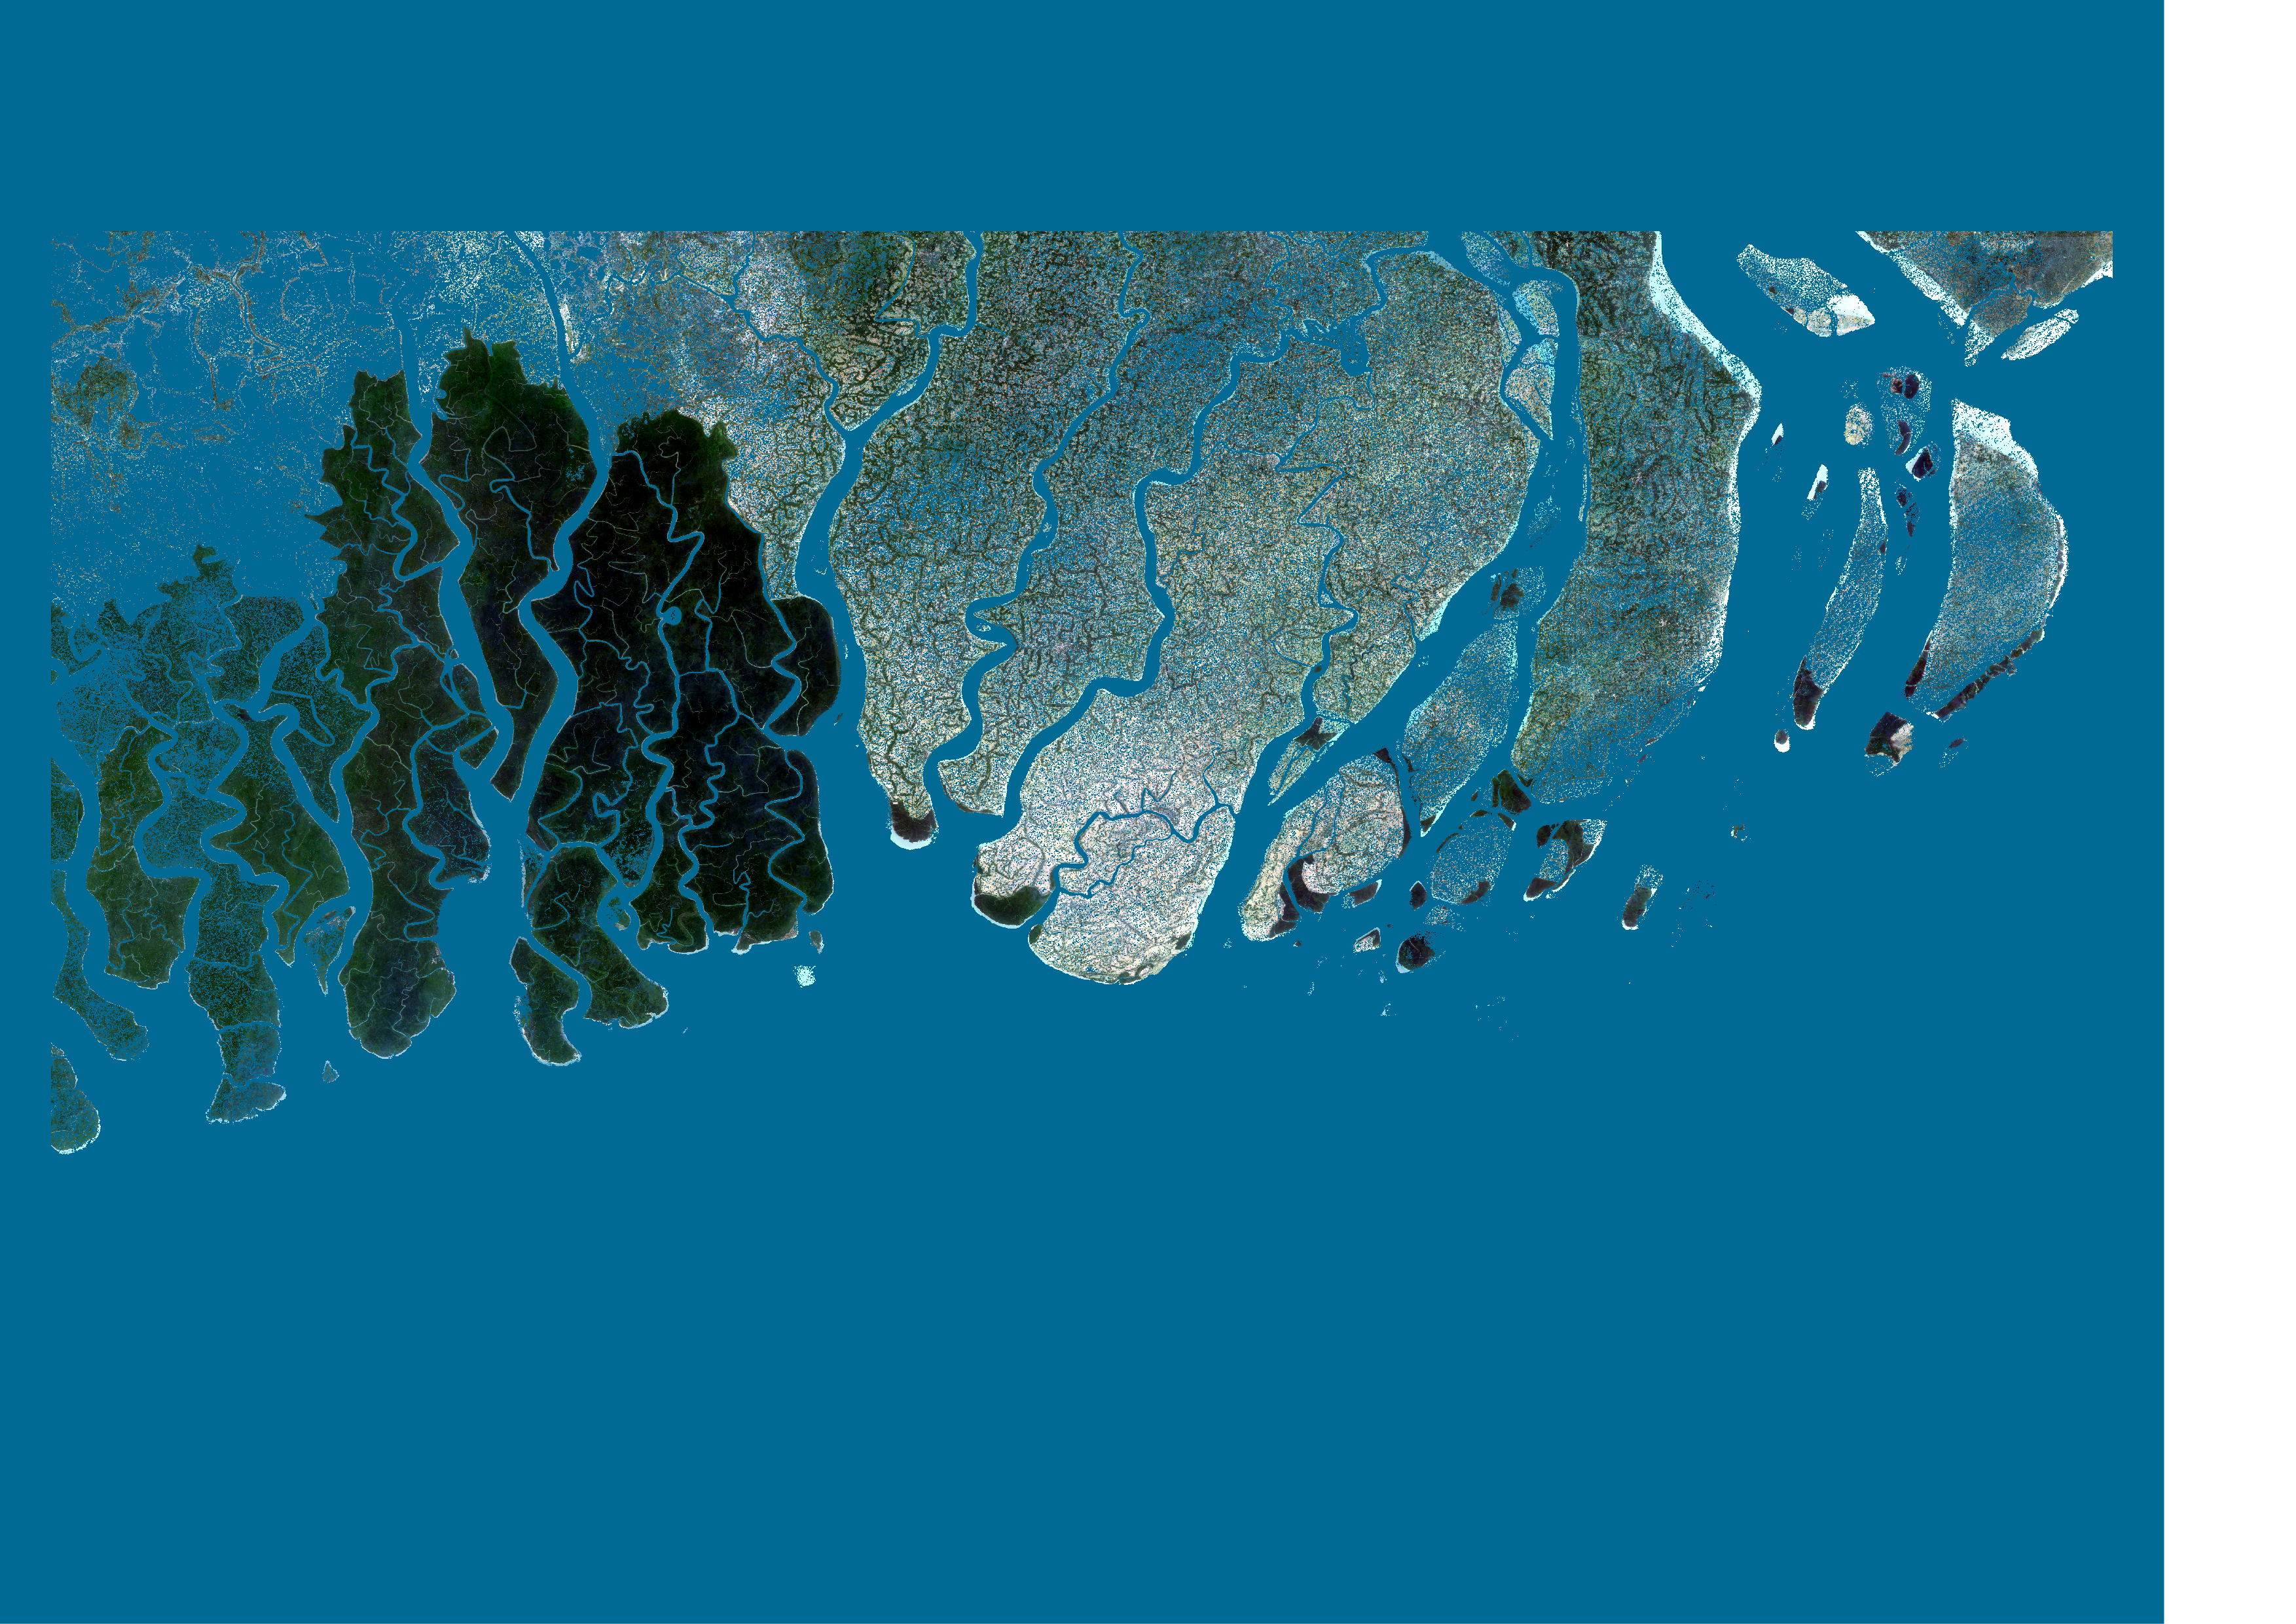
The same thing applied to Southern Bangladesh, another area at severe risk of flooding:
Melting glaciers
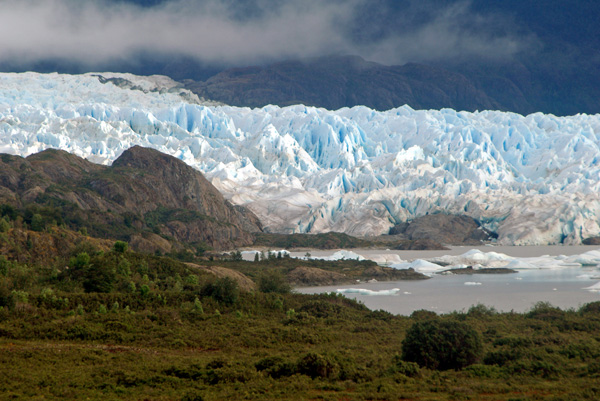
Melting ice also contributes to the rising water. One of the largest glaciers is the San Quintin in the Northern Patagonian Icefield. Here's it seen from the ground:
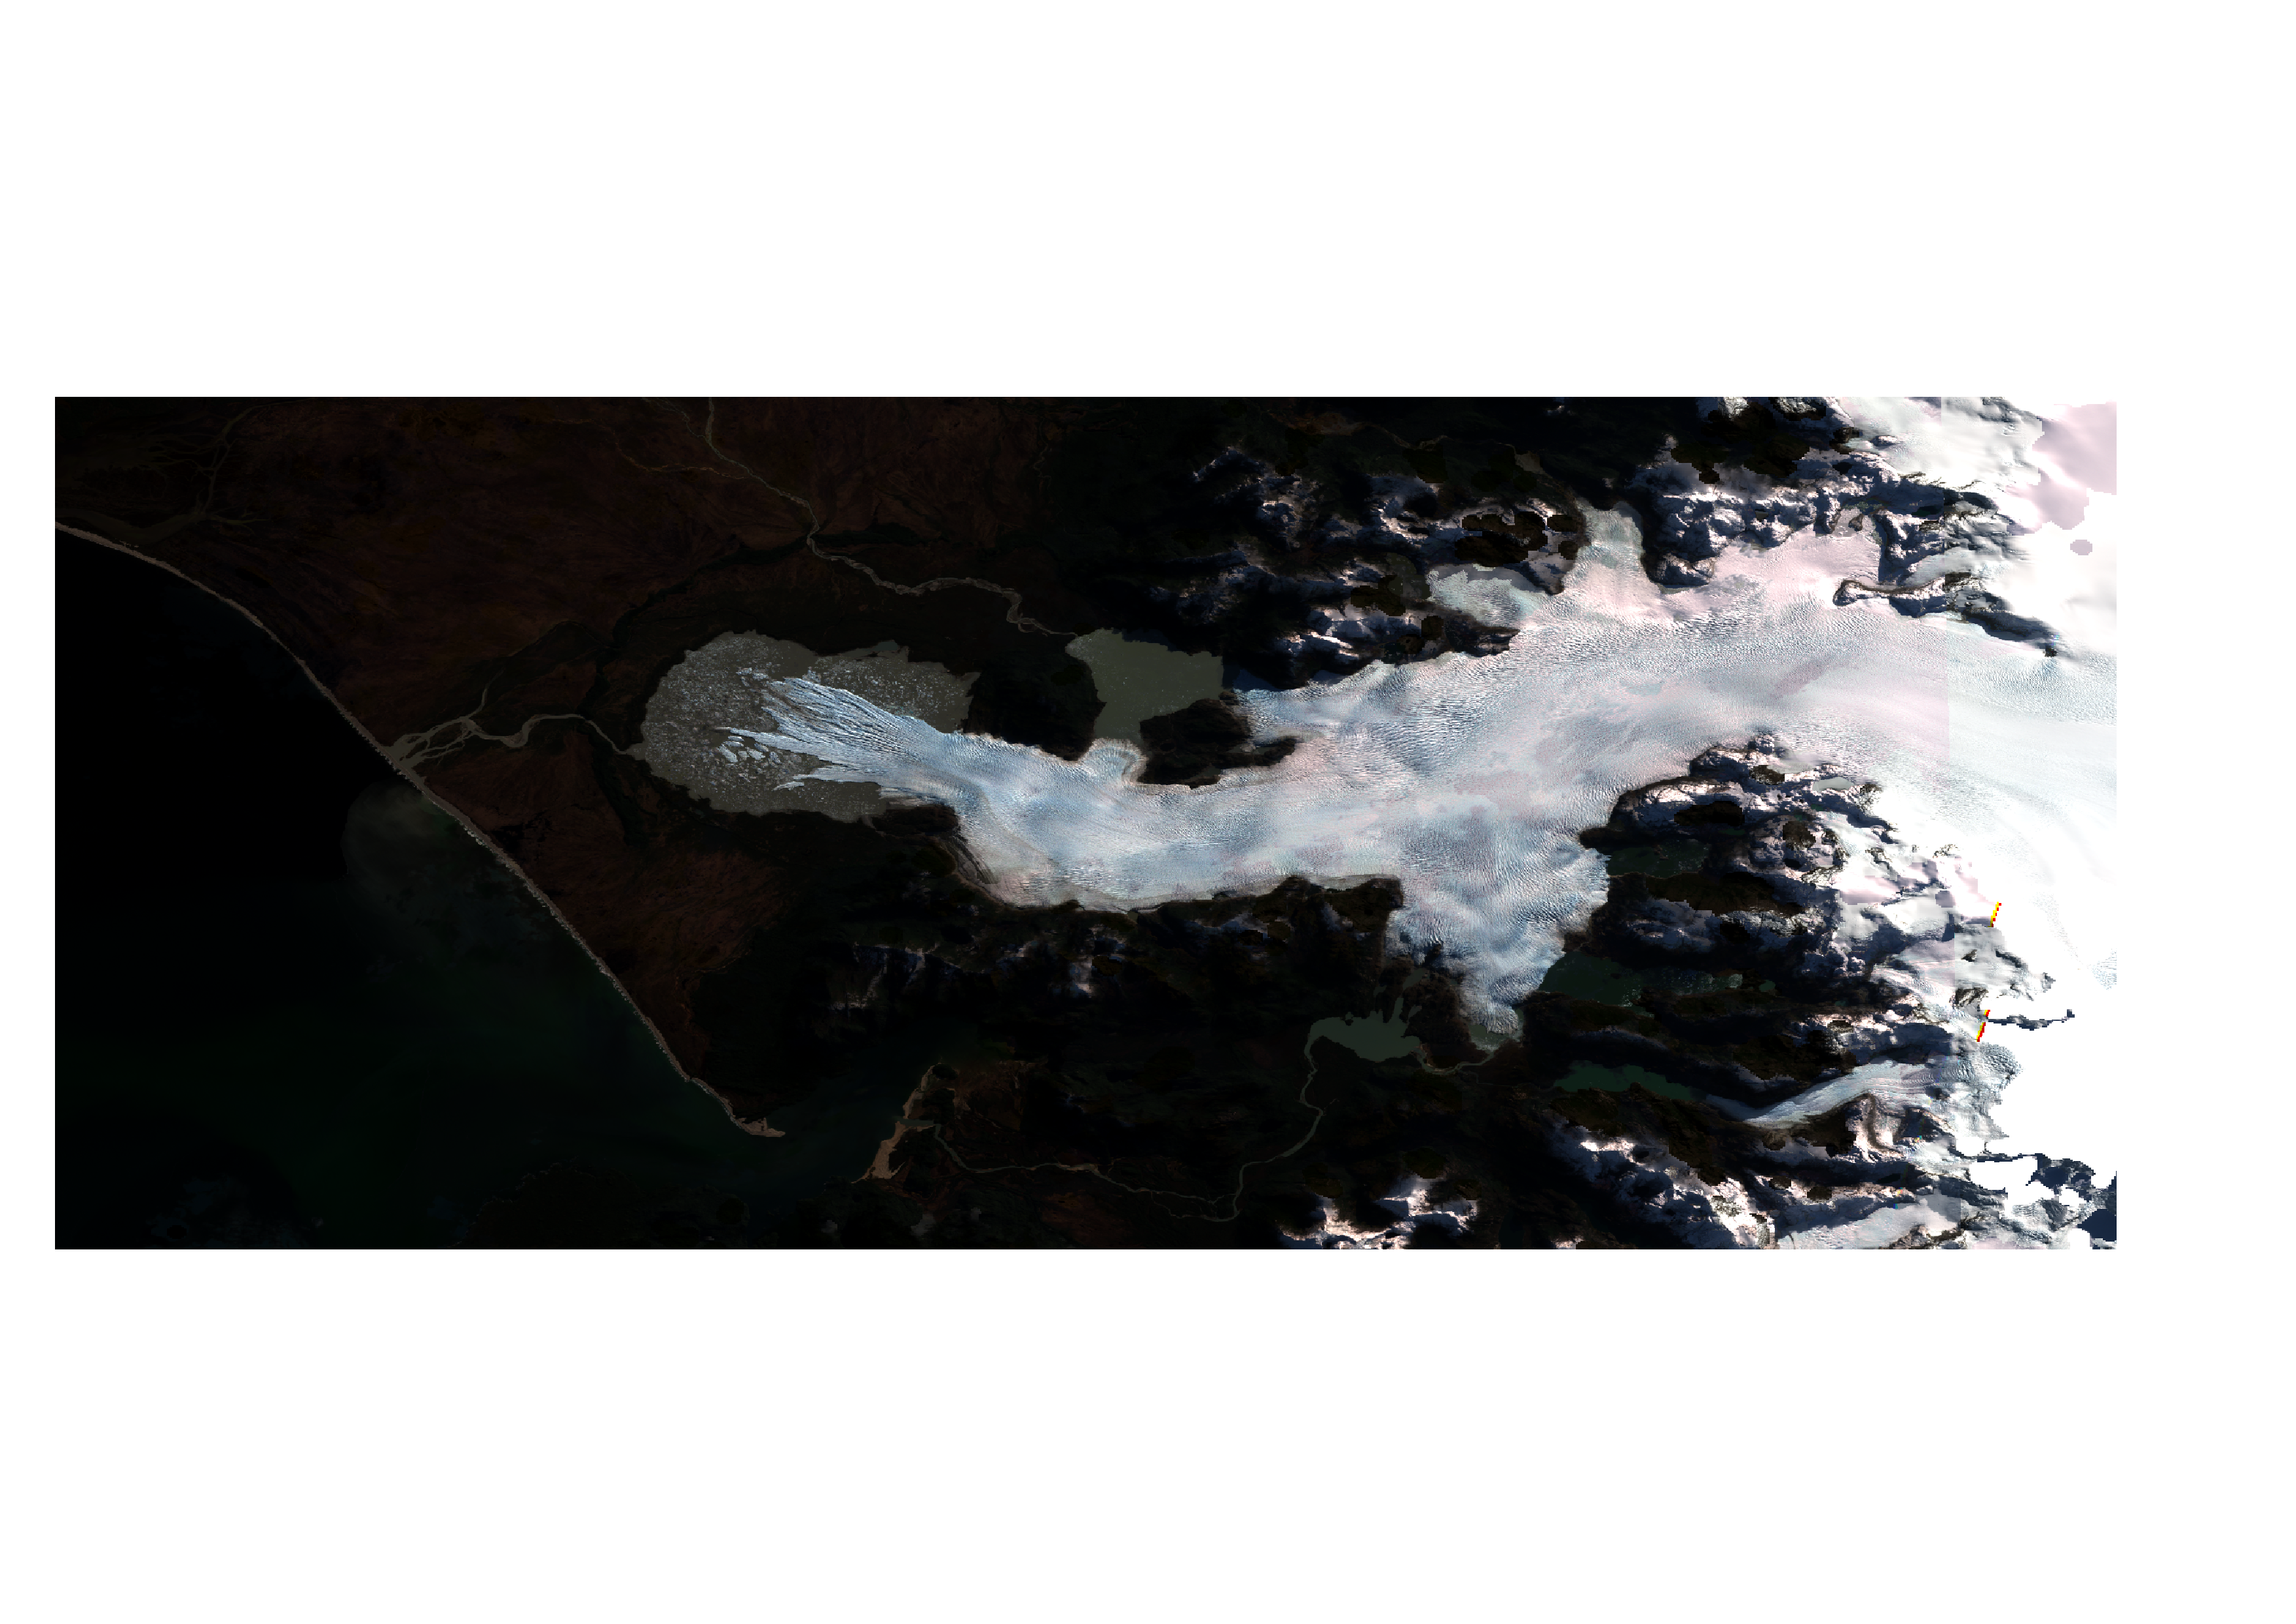
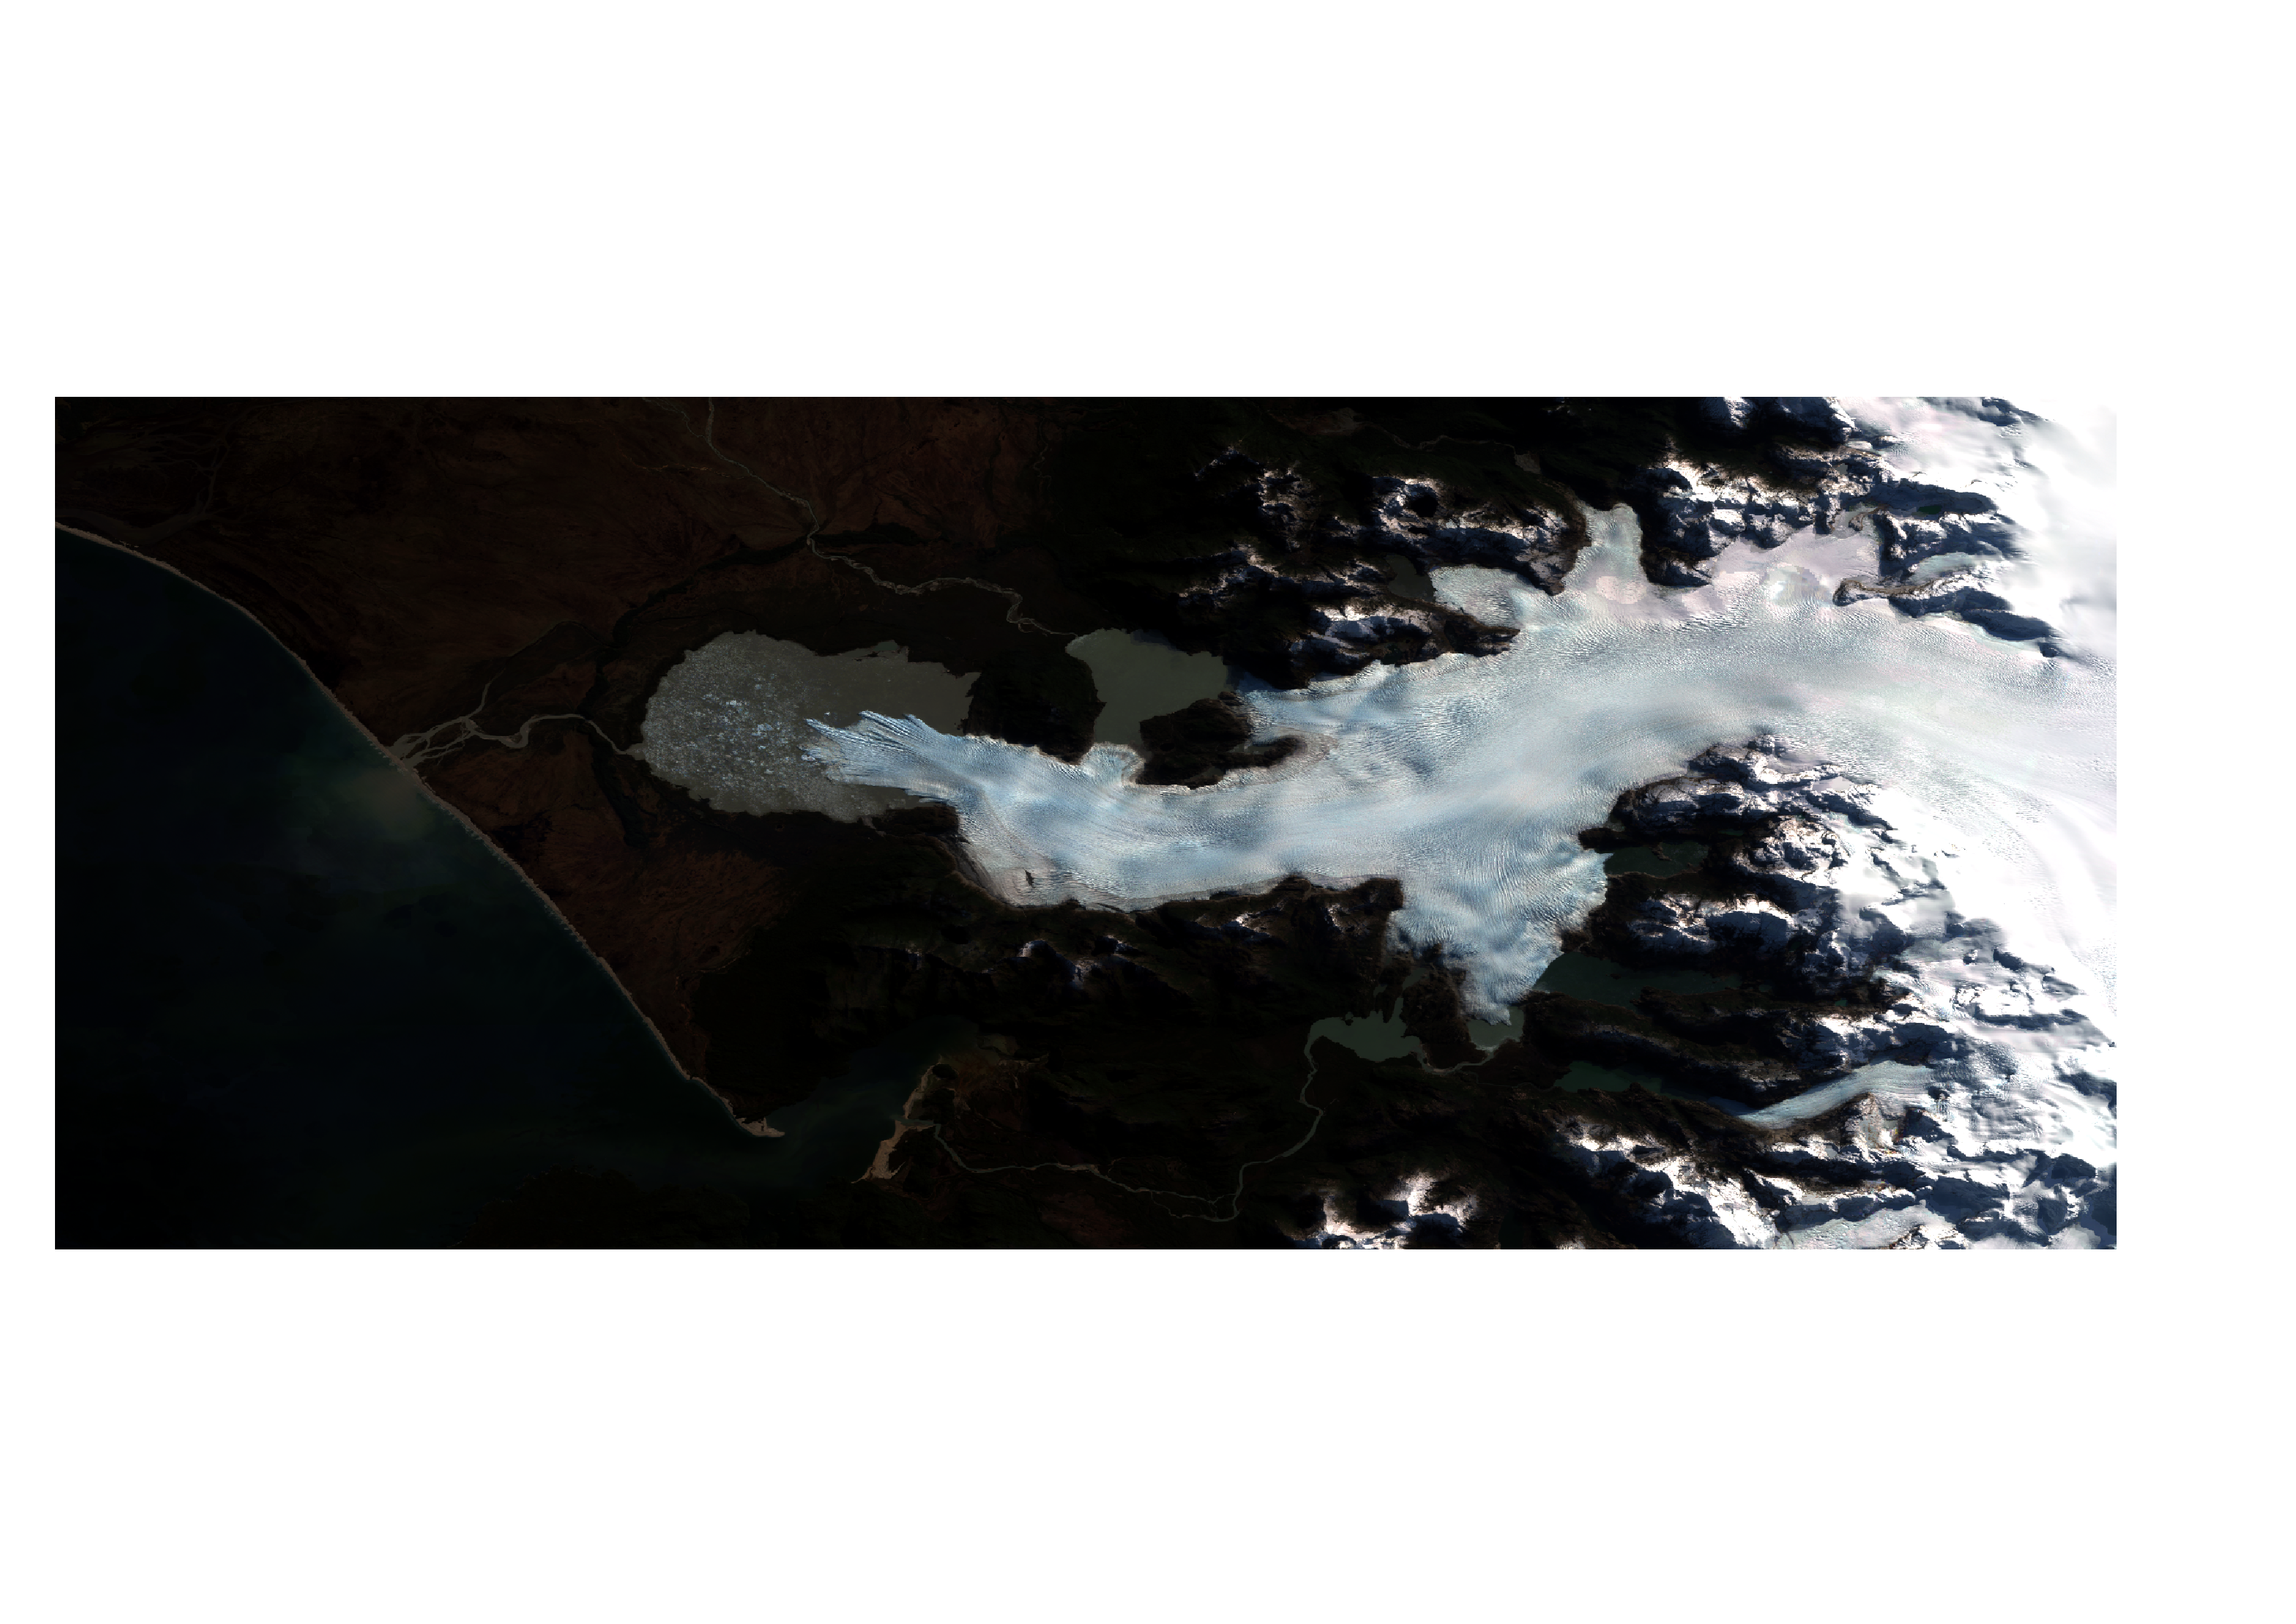
Using the GEE I grabbed Sentinel satellite images of it, one from some years ago, and one from present day, both from peak ice season. It can be seen that the glacier has retreated during these years.
Overall thoughts
Effectively, GEE does everything for you. There's no need to install software, to download data, unpack and process it, and to visualise it with some plotting scripts. It's really quite convenient.
There're some things about it though that I wish could be better, or better documented. For example, it is not clear how this API can be called outside the GEE, say in a web application you are building. Maybe this is what the Python APIs are for.
As far as I know, analysis results can only be exported to a Google Drive or a Google Cloud Platform storage. Exporting to Google Drive is a manual process, where you need to click some buttons, so it's not possible to automate it. However, once the data has been reduced to a manageable set, you can download it as, say, a csv file and process or analyse it with tools you are familiar with. But as far as geo-spatial data goes, this most likely needs to be in a heavily reduced form.